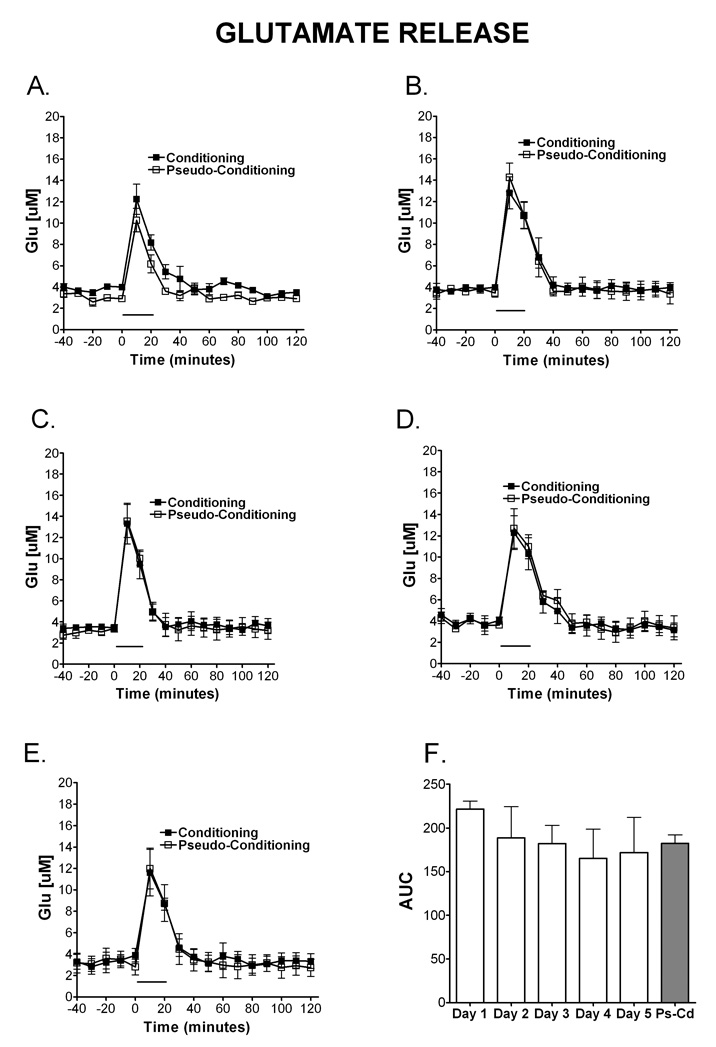
Figure 4. Temporal release of glutamate during eyelid conditioning.
Microdialysis was performed in the cerebellar cortex on rats during training in the delay eyelid conditioning task. The release of Glu over time during eyelid conditioning is shown on day 1 (A; N=4 condition, 4 pseudocondition), day 2 (B; N=4 condition, 4 pseudocondition), day 3 (C; N= 4 condition, 3 pseudocondition), day 4 (D; N=4 condition, 3 pseudocondition) and day 5 (E; N= 4 condition; 4 pseudocondition). Comparable levels of glutamate were released during training on the eyeblink task for both the conditioning and the pseudoconditioning groups. Data are expressed as Glu [µM] (y-axis). Black squares represent conditioning, open squares represent pseudoconditioning. (F) Area under the curve representation of Glu release for each day of training during eyelid conditioning and pseudoconditioning (Ps-Cd, average of days). There were no differences in AUC of Glu. The solid bar underneath the curves indicates the time when the rats were receiving training trials.

