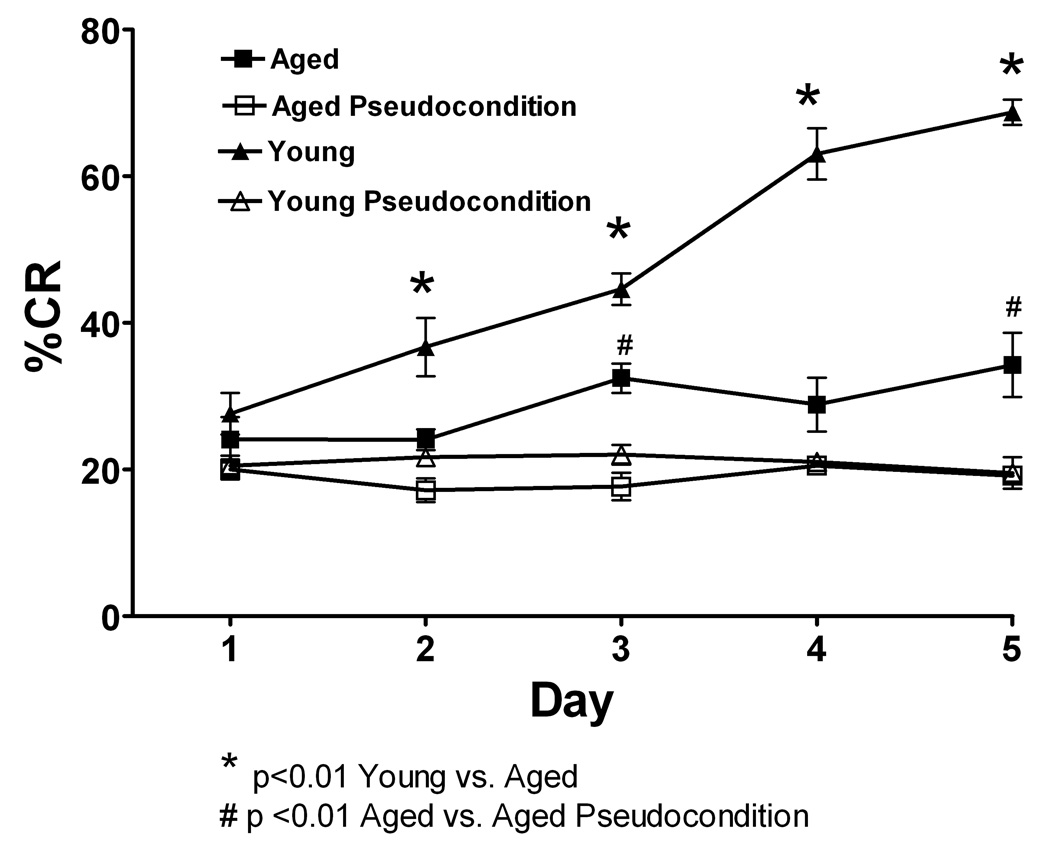
Figure 8.
Eyelid conditioning was performed over 5 days. The Y-axis shows the percentage of conditioned response (% CR’s), the x-axis represents 5 daily training sessions of 50 trials. Black triangles represent young conditioning, open triangles are young pseudoconditioning, black squares represent aging conditioning, open squares are aging pseudoconditioning. Both aging and young rats performed significantly better than their age-matched pseudoconditioning groups. For the conditioning groups, young rats learned the task faster and to a higher performance level than aged rats (p<0.01). * indicates difference between young and aged, # indicates difference between aged conditioning and aged pseudoconditioning.

