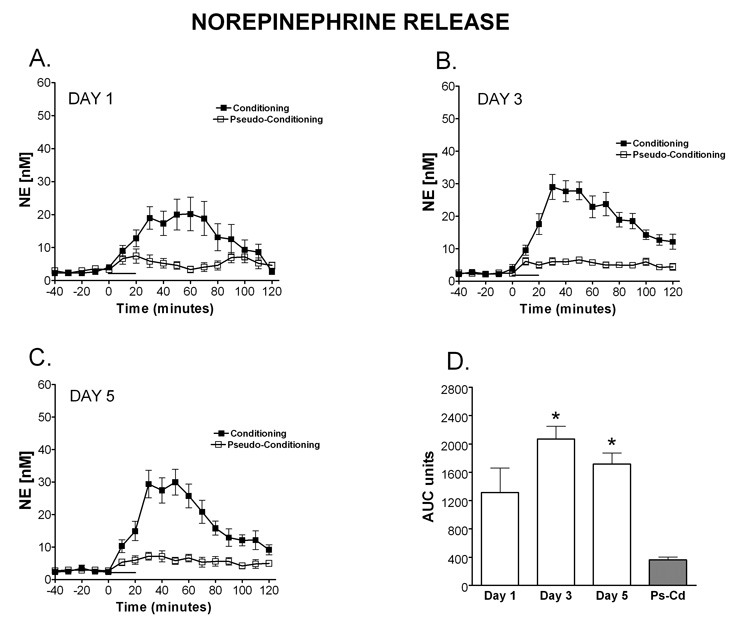
Figure 9.
Microdialysis was performed in the cerebellar cortex of aged rats during training in the delay eyelid conditioning task. The time window of NE release once eyelid conditioning starts can be observed on day 1 (A; N= 6 condition, 5 pseudocondition), day 3 (B; N= 6 condition, 5 pseudocondition) and day 5 (C; N= 6 condition, 5 pseudocondition). Data are expressed as NE [nM] (y-axis) over time in 10 minute dialysate samples (x-axis). Black squares represent conditioning, open squares represent pseudoconditioning. D) Area under the curve (AUC units) representation of NE release for each day of training during eyelid conditioning.

