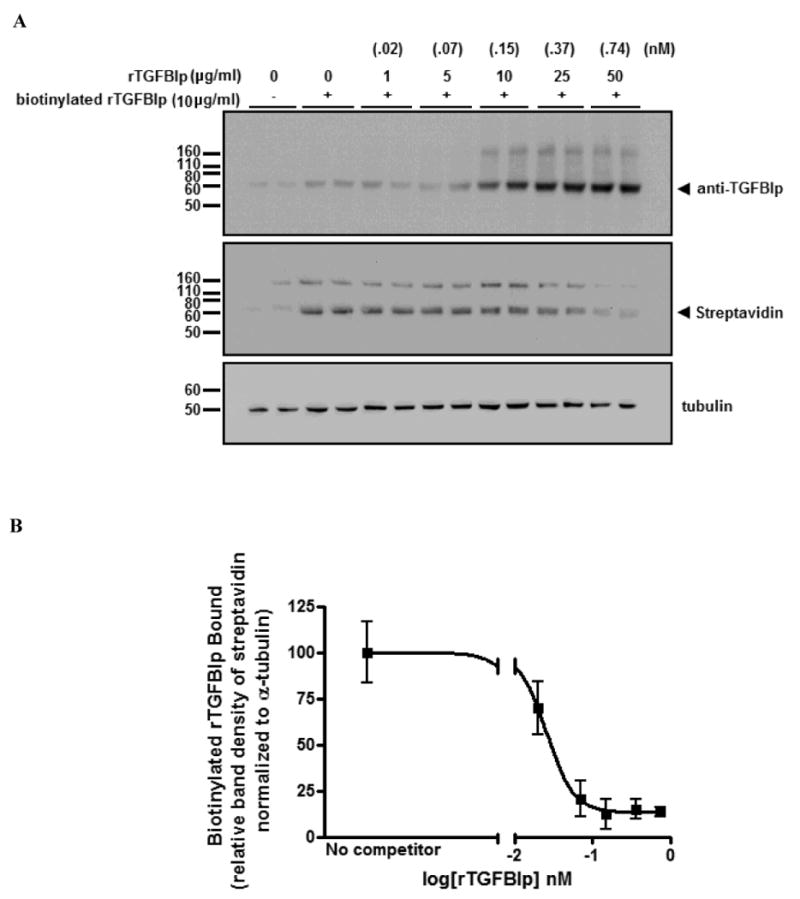
Figure 4. Competition binding assay.

A) Representative western blot from three independent experiments in duplicate of cell lysates from HSFs incubated with soluble biotinylated rTGFBIp in the presence of increasing amounts of nonbiotinylated rTGFBIp (competitor) probed with anti-TGFBIp and streptavidin conjugated to alkaline phosphatase. Note reduced biotinylated rTGFBIp binding in the presence of competitor. B) Competitive inhibition curve for specific binding of biotinylated rTGFBIp by increasing concentrations of nonbiotinylated rTGFBIp. The 50% inhibition concentration (logIC50) was calculated to be -1.54 nM (IC50 = .03 nM). Data is expressed as band intensity of biotinylated rTGFBIp relative to α-tubulin. The data were fitted into an IC50 equation using GraphPad Prism software. For the loading control, all blots were stripped and reprobed with α-tubulin antibody. Arrowhead indicates position of the 68 kD band.
