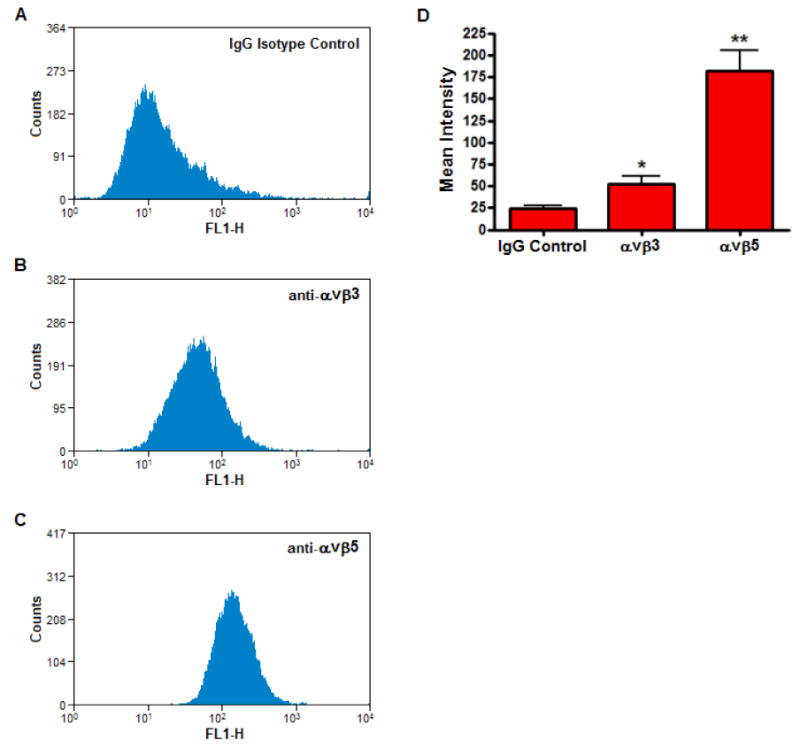
Figure 5. Integrin expression on the surface of HSFs.

Flow cytometry on live HSFs incubated with 4 μg/ml of IgG isotype control (A), or the monoclonal antibodies, anti-αvβ3 (B) and anti-αvβ5 (C). The data are expressed as cell counts (y-axis) plotted as a function of fluorescence intensity (x-axis) and are representative of three independent experiments. D) Histogram represents the mean intensities of anti-αvβ3 and anti-αvβ5 from flow cytometric analysis as compared to the IgG isotype control. Data are expressed as the mean ± SEM by the Student's t-test for unmatched pairs for four individual experiments (*p < 0.05, **p < 0.01).
