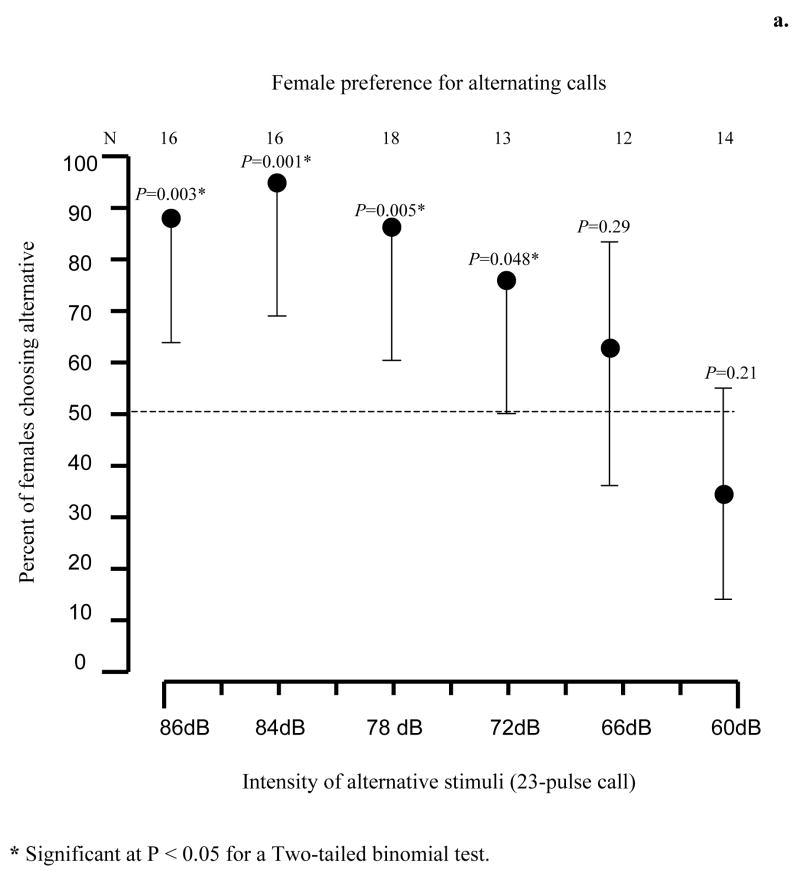
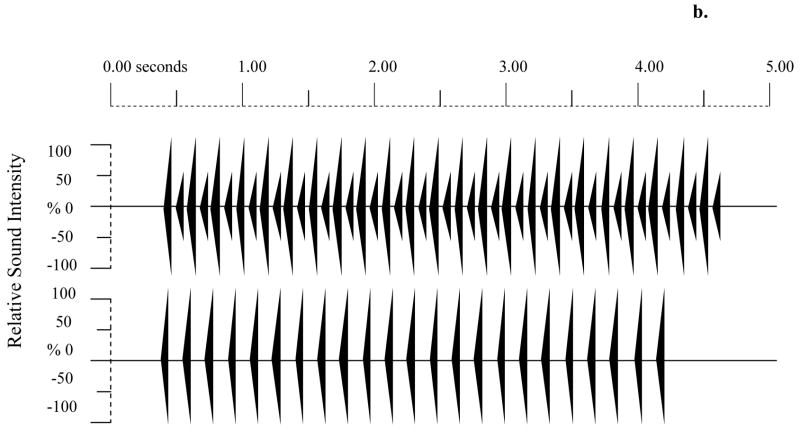
Figure 5.
a. Recognition and preference of call overlap. Error bars are 95% credible intervals; a single error bar denotes a significant (p < 0.05) preference in a two-tailed binomial test. b. Oscillograms of the stimuli used on this test. Top panel shows two simulated 23-pulsed call in overlap, bottom panel shows the 23-pulse stimulus. The overlapped call broadcast at an intensity of 86 dB @ 1m in all tests, the intensity of the single call in each test was broadcast at one of the following intensities: 84 dB, 78 dB, 72 dB, 66 dB, or 60 dB @ 1m.


