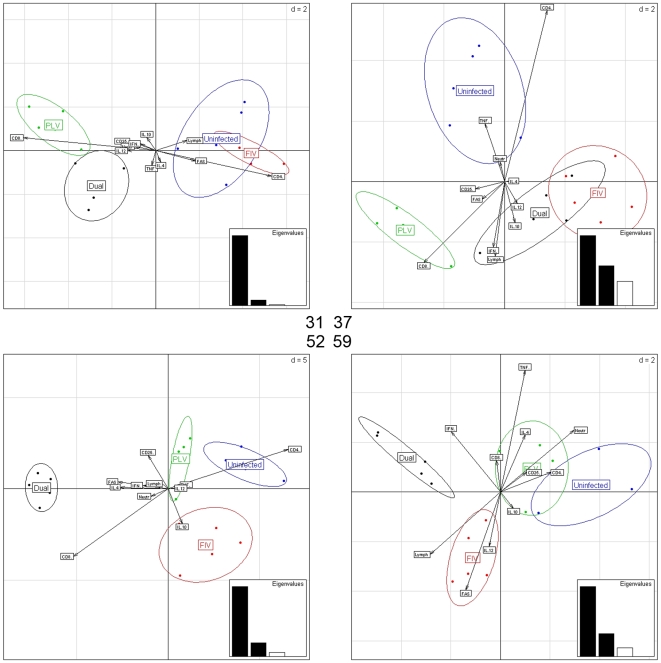
Figure 2. Bi-plots from LDA, for days 31 (upper left), 37 (upper right), 52 (lower left) and 59 (lower right).
The horizontal and vertical axes on each panel represent first and second LDA direction, respectively. The arrows depict loadings of the 11 responses; their orientation and length indicate the role of each immunological parameter in relation to the LDA directions and the different infection groups, on each of the analysis days. The insets in each panel show first, second and third LDA eigenvalue (discriminatory importance of the corresponding LDA directions).

