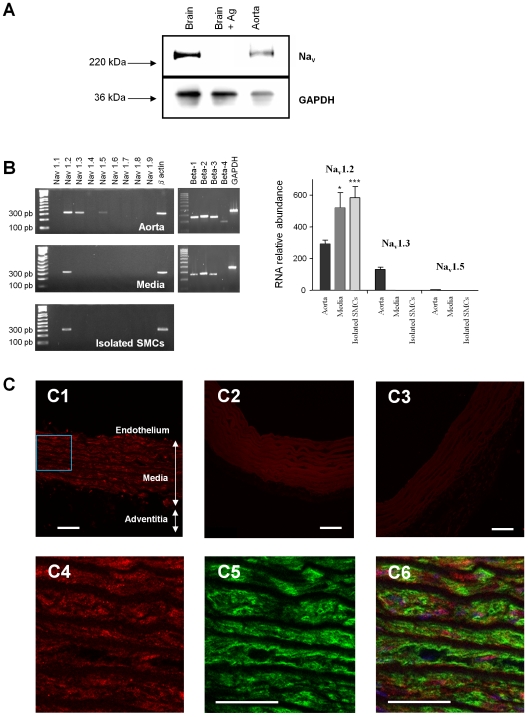
Figure 1. Identification of Nav channels in the rat aorta and isolated vascular myocytes.
(A) Western blot analysis of protein extracts from control tissues (brain; 10 µg of total protein extract per tissue) and aorta (50 µg of total protein extract per tissue) performed using an anti-Pan Nav channel antibody. Labeling specificity was assessed in the brain by pre-incubating the primary antibody with the peptide antigen. Cellular protein content was estimated from the GAPDH signal (lower panel). Arrows indicate the migration of the molecular weight marker (220 and 36 kDa). (B) Analysis of Nav transcripts in total RNA extracted from rat aorta, aortic media and freshly isolated SMCs: representative images obtained after end-point RT-PCR. β-actin or GAPDH primers were used as positive controls to validate reverse transcription. The panel at right shows a sample quantification of Nav isoform transcripts. The expression of Nav1.2, 1.3 and 1.5 was evaluated by quantitative real-time RT-PCR. Transcript levels were normalized to that of the GAPDH housekeeping gene in each sample and compared in the whole aorta, media layer and freshly isolated SMCs. Data are expressed as means ±s.e.m. of five experiments, each performed in triplicate. *p<0.05; ***p<0.001, unpaired t-test. (C) Immunolocalization of Nav channels in aortic tissue. The upper panel represents typical confocal images obtained from successive sections of rat aorta using a 20X objective; (C1) Specific anti-Pan labeling; arrows indicate the endothelium, media and adventitial layers; (C2) negative control without primary antibody; (C3) negative control with the peptide antigen. Lower panels correspond to high magnification (60X objective) images of the inset in C1, showing immunofluorescence staining for Nav channels (C4), α-actin (C5), and double immunofluorescence staining with TOTO counterstaining (blue) (C6). Scale bars - 50 µm.

