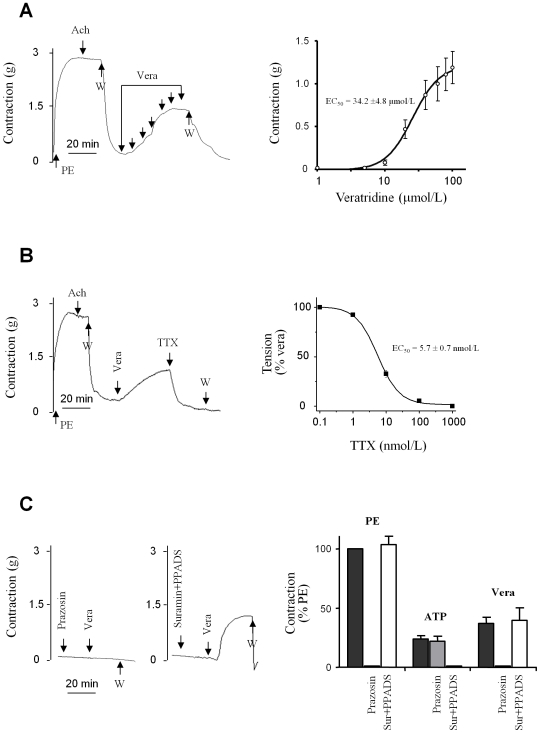
Figure 2. Contractile response of rat aortic rings to veratridine.
(A) Veratridine-induced vasoconstriction. Left panel: typical recordings of the isometric response to cumulative doses of veratridine (vera). The absence of endothelium was first confirmed by the lack of vasorelaxing effect of 1 µmol/L acetylcholine (Ach) on the contraction evoked by a sub maximal concentration of phenylephrine (PE; 1 µmol/L). After washing (W), increasing concentrations of veratridine (arrows), from 5 to 100 µmol/L, were added. Right panel: concentration-response curves of veratridine (EC50 = 34.2±4.8 µmol/M). (B) Vasorelaxing effect of TTX (1 µmol/L) on the contraction induced by 100 µmol/L veratridine (representative isometric response, left panel). The dose-response curve was obtained by addition of cumulative concentrations of TTX (0.1 nmol/L to 1 µmol/L) after maximal contraction was evoked by 100 µmol/L veratridine. Values are expressed as a percentage of the maximal contraction induced by veratridine. (C) Effect of veratridine in the presence of prazosin or suramin plus PPADS (left panel). The graph (right panel) represents the contractions induced by PE (1 µmol/L), ATP (100 µmol/L) and veratridine (100 µmol/L) under basal conditions or in the presence of either 10 µmol/L prazosin or a cocktail of suramin (300 µmol/L) and PPADS (30 µmol/L). Data are expressed as a percentage of the response induced by PE (1 µmol/L). All values represent means ±s.e.m. of five experiments, each performed in triplicate.

