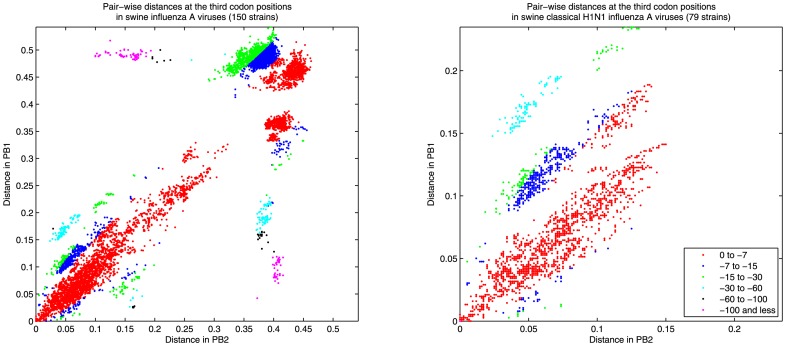
Figure 1. Pair-wise hamming distances at the third codon positions in PB2 vs. PB1.
The colors demonstrate the logarithm of the cumulative probability for the points, among which the ones with a cumulative probability of less than 10−7 indicate possible reassortment events. Left: The results from 150 strains in the dataset, where there are candidates for reassortment events in both PB2 and PB1. Right: The results when the dataset is limited to the classical H1N1 strains isolated in the 70's, 80's, and 90's, where there are distinctively more candidates for reassortment events in PB1.

