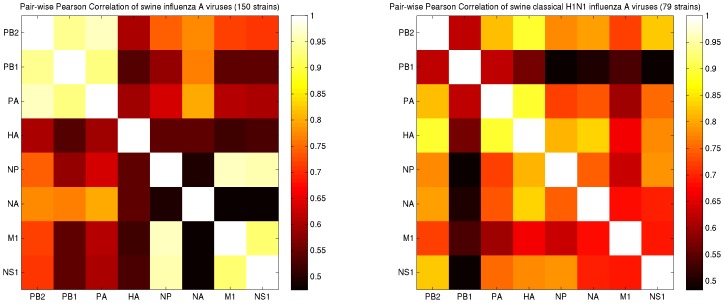
Figure 4. Pair-wise Pearson correlation of the distances at the third codon positions of the viral segments.
Left: The HA, NA, and PB1 segments have the least correlation in regards to the rest of the segments. Right: When the HA and NA variations are fixed in the population by limiting the dataset to the classical H1N1 strains isolated in the 70's, 80's, and 90's, PB1 presents a distinctively lower correlation relative to the other segments.

