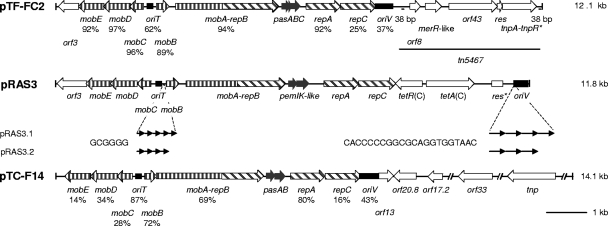
FIG. 1.
Comparison of the genetic maps of the pRAS3 plasmids with pTF-FC2 and pTC-F14. Percentages below the plasmid backbone genes of pTF-FC2 and pTC-F14 indicate the percent amino acid sequence identity of the gene product with that of the pRAS3 plasmids. Percentages below the oriT and oriV regions indicate nucleotide sequence identity. Plasmids pRAS3.1 and pRAS3.2 have different numbers of 6-bp repeats and 22-bp iterons, while the nucleotide sequence of each repeat or iteron is identical, as indicated below pRAS3.

