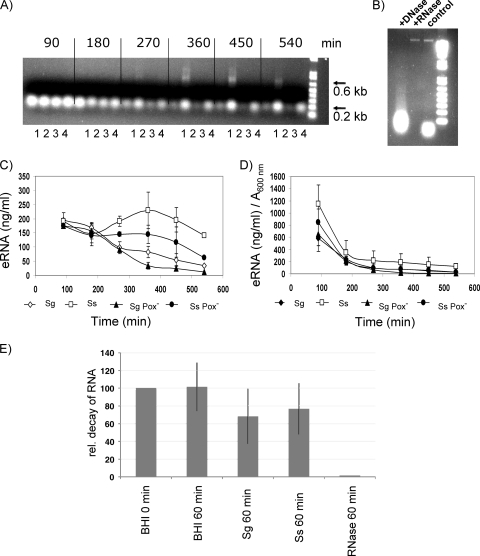
FIG. 4.
Characterization of eRNA. (A) Agarose gel electrophoresis (1%) of RNA stained with ethidium bromide (1 μg/ml) as described in Materials and Methods. The photograph is representative of three independent experiments with similar results. Lanes: 1, S. gordonii; 2, S. sanguinis; 3, S. gordonii Pox−; 4, S. sanguinis Pox−. (B) Precipitated nucleic acids from S. gordonii were digested with DNase RQ1 and RNase A, resolved by agarose gel electrophoresis (1%), and stained with ethidium bromide (1 μg/ml). (C) Quantification of eRNA by use of an RNA-specific fluorescent dye with the Quant-iT RNA assay. Sg, S. gordonii; Ss, S. sanguinis. (D) Relative amounts of RNA normalized to cell density measured at A600. Data presented are the means ± SD of results from three independent experiments done on different days. (E) eRNA degradation. Total RNA from S. mutans (2 μg/ml) was added to the cultures. After 60 min of incubation, a 1-ml aliquot was removed. RNA was precipitated and analyzed for decay on an agarose gel by comparing pixel intensities of RNA bands with ImageJ software (http://rsb.info.nih.gov/ij/). Shown are means ± SD of results from at least two independent experiments with BHI, with the 0-min arbitrary level set to 100%.

