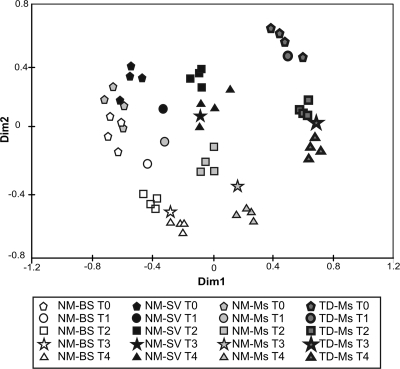
FIG. 2.
MDS analysis of 16S rRNA gene PCR-TTGE band patterns, based on a dissimilarity distance matrix generated from a presence/absence of each TTGE band in the samples. TTGE analysis was performed separately on the four replicate plots for each treatment at T0, T2, and T4 (September 2005, 2006, and 2007, respectively). For the samples collected in May 2006 and 2007 (T1 and T3), only one plot was analyzed.

