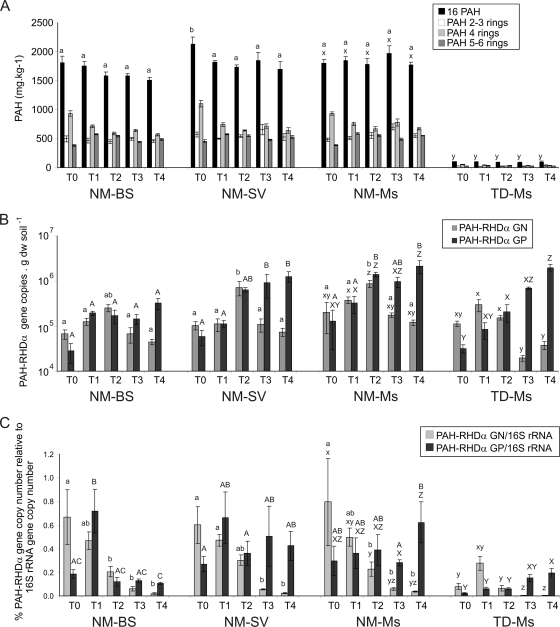
FIG. 4.
PAH concentration (A), PAH-RHDα GN and GP bacterial gene copy numbers determined by real-time PCR quantification on DNA (B), and percentage of PAH-RHDα genes relative to 16S rRNA gene copy numbers (C) during the 2-year period (from T0 to T4) of the four plot type analysis. Mean values based on the four replicate plots of each treatment are presented with their corresponding standard errors. Different letters indicate significant differences (P < 0.05) between plots (letters a and b or A, B, and C for the comparison between NM-BS, NM-SV, and NM-Ms, and letters x, y, and z or X, Y, and Z for the comparison between NM-Ms and TD-Ms). In panel A, statistical analysis values were not presented for the different groups of PAHs but rather for the 16 PAHs. In panels B and C, lowercase letters refer to statistics on PAH-RHDα GN bacterial genes and the PAH-RHDα GN/16S rRNA gene ratio, and capital letters refer to statistics on PAH-RHDα GP bacterial genes and the PAH-RHDα GP/16S rRNA gene ratio.

