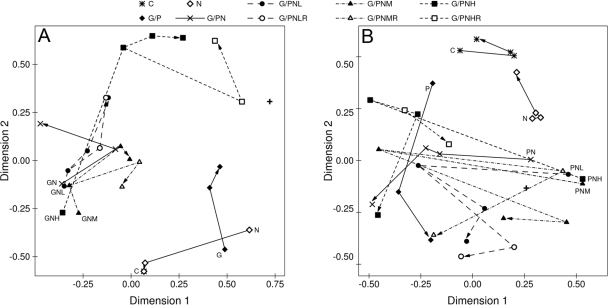
FIG. 2.
Nonmetric multidimensional scaling diagram of bacterial community profiles based on denaturing gradient gel electrophoresis of the V3 region of the 16S rRNA gene amplified by PCR of DNA extracted from anaerobic microcosms. Treatments included combinations of electron acceptor (none or NO3− [N]) and one of four levels of Cr(VI) (none, low [L], medium [M], or high [H]). In addition, microcosms were amended with glucose (G) (A) or protein (P) (B) as an electron donor. Each panel also includes results from a control treatment (C) to which no amendments were made. All treatments were set up in triplicate and sampled at four times (T1 to T4). Each point on the graph represents the average score for the three replicate samples. The initial T1 sample (48 h of incubation) is identified by the position of the legend code on the graph. The trajectory of community composition through time is indicated by the line and arrow connecting treatment points. Trajectories are drawn with solid lines for treatments without chromium and dashed lines for chromium-amended treatments. For comparison, the untreated soil bacterial community used to construct the microcosms is represented by a + symbol.

