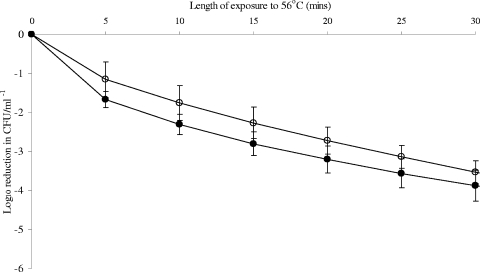
FIG. 1.
Effect of exposure to 6°C on the shape of the death curve for C. jejuni 2097e48 at 56°C. Weibull analysis was performed on triplicate biological replicates for the resulting death curves of C. jejuni 2097e48 at 56°C, before and after exposure to 6°C. Open circles represent controls (37°C), and closed circles represent cells exposed to 6°C before heat treatment. Death values were analyzed using ANOVA at each time point. P values of <0.05 were considered significantly different; no significant differences were seen at any time points.

