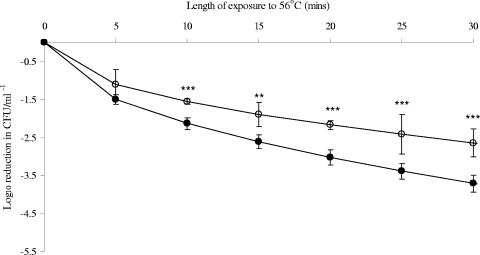
FIG. 3.
Effect of exposure to 6°C on the shape of the death curve for E. coli at 56°C. Weibull analysis was performed on triplicate biological replicates for the resulting death curves of E. coli K-12 at 56°C, before and after exposure to 6°C. Open circles represent controls (37°C), and closed circles represent cells exposed to 6°C before heat treatment. Mean values resulting from Weibull analysis of death curves are shown, with standard deviations given as error bars. Death values were analyzed using ANOVA at each time point. P values of <0.05 were considered significantly different and are shown on the figure as follows: *, P < 0.05; **, P < 0.01; and ***, P < 0.001.

