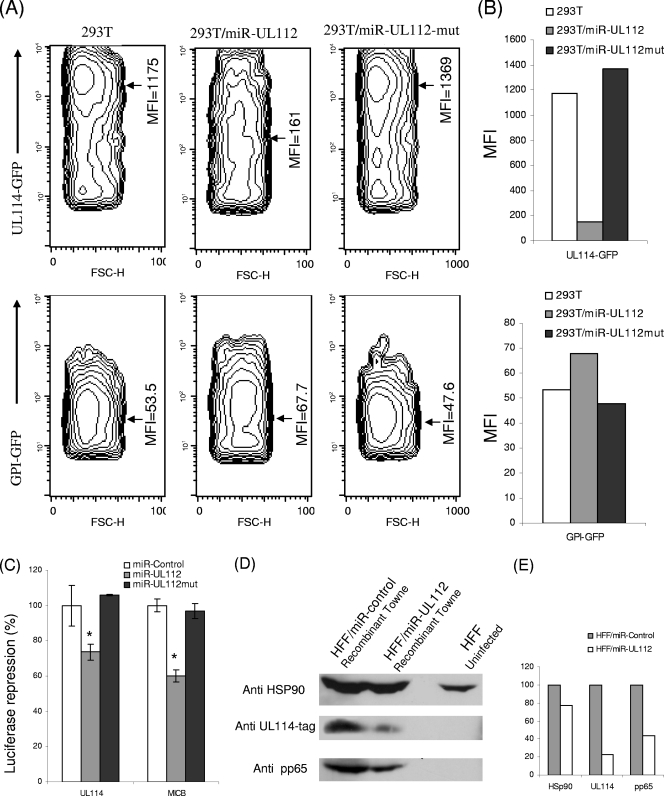
FIG. 3.
miR-UL112 downregulates the viral protein UL114. (A) 293T cells were transduced either with an empty vector, with miR-UL112, or with miR-UL112mut. These cells were transfected with either the UL114-GFP plasmid or the GPI-GFP plasmid as indicated on the y axis. GFP intensity was assessed by FACS 40 hours after transfection. The contour plots present GFP intensity, with contour lines being drawn to form x and y coordinates that have similar numbers of cells. This gives a 3-dimensional-like display, with the third dimension coming out as the counts. The MFI are specified and marked with arrows. (B) Graphical representation of the MFI of GFP presented in panel A. Data are representative of three independent experiments. (C) Relative luciferase activity after reporter plasmids (indicated on the x axis) were transfected into the indicated cells. Firefly luciferase activity was normalized to Renilla luciferase activity and then normalized to the average activity of the control reporter. Values are means ± standard deviations for triplicate samples. *, P < 0.005 for 293T cells expressing miR-UL112 versus cells expressing miR-UL112mut. (D) HFF were transduced with lentiviruses encoding GFP together with miR-UL112 or a control miRNA. These cells were then infected with the UL114 ICP4-tagged recombinant Towne virus (MOI, 1). Cells were lysed 72 h postinfection and were subjected to Western blot analysis using the indicated antibodies. (E) The amounts of proteins presented in panel D were quantified by densitometry. Protein amounts in the HFF/miR-Control cells were set at 100%, and the amounts of the proteins in HFF/miR-UL112 cells were calculated accordingly.

