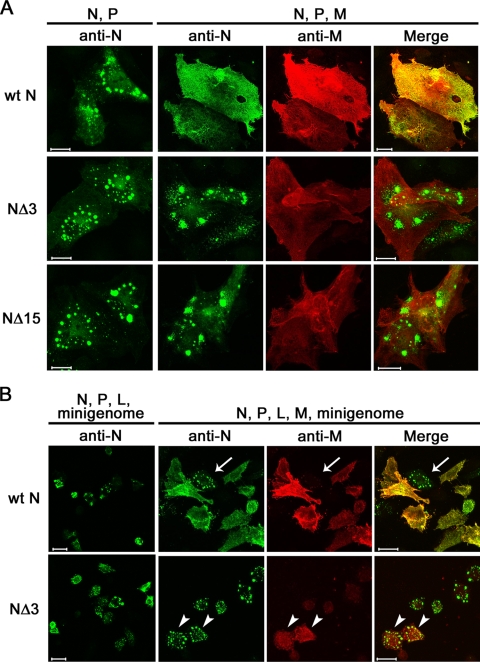
FIG. 3.
Intracellular distributions of the N and M proteins analyzed by indirect immunofluorescence and confocal microscopy. (A) CV-1/hSLAM cells were transfected with pCA7-IC-N (wt N), pCA7-IC-NΔ3 (NΔ3), or pCA7-IC-NΔ15 (NΔ15) together with pCA7-IC-PΔC (N, P). Cells were also transfected with pCA7-IC-N (wt N), pCA7-IC-NΔ3 (NΔ3), or pCA7-IC-NΔ15 (NΔ15) together with pCA7-IC-PΔC and pCA7-IC-M (N, P, M). At 48 h posttransfection, the intracellular distributions of the N and M proteins were analyzed by indirect immunofluorescence and confocal microscopy. The primary antibodies used were a rabbit polyclonal antibody against the N protein and a mouse monoclonal antibody against the M protein. The secondary antibodies were Alexa Fluor 488-conjugated anti-rabbit and Alexa Fluor 594-conjugated anti-mouse antibodies, respectively. Bar, 20 μm. (B) VV5-4 cells infected with vTF7-3 were transfected with the MV minigenome plasmid (p18MGFLuc01) together with three support plasmids expressing the N, P, and L proteins (N, P, L, minigenome). Either pCA7-IC-N (wt N) or pCA7-IC-NΔ3 (NΔ3) was used as the N protein expression plasmid. Cells were also transfected with pCA7-IC-M together with the minigenome plasmid and three support plasmids (N, P, L, M, minigenome). At 48 h posttransfection, the intracellular distributions of the N and M proteins were analyzed by indirect immunofluorescence and confocal microscopy as described for panel A. Arrows and arrowheads indicate cells expressing M protein at low and high levels, respectively. Bar, 20 μm.

