FIG. 5.
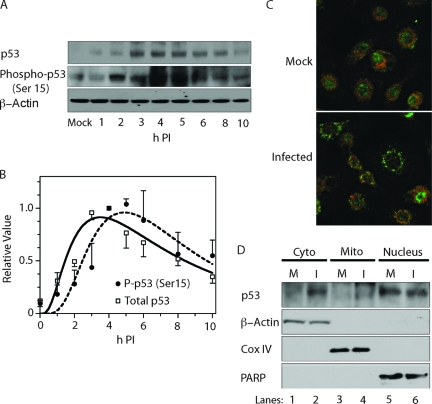
Role of p53 activation in BeAn virus-induced apoptosis. (A) Immunoblot demonstrating increased levels of total p53 beginning at 1 to 2 h p.i. and of phospho-p53 Ser 15 at 3 to 6 h p.i. (B) Relative densitometric values ± the standard deviation of three immunoblots (a representative immunoblot is shown in panel A). (C) Double-immunofluorescence staining showing p53 (green) in the nucleus and MitoTracker (red) staining in the cytoplasm of mock-infected cells, whereas p53 staining is seen in the cytoplasm but does not colocalize with mitochondria of infected cells at 3 h p.i. (D) Immunoblotting after cell fractionation showing p53 primarily in the nuclear (PARP-positive) fraction of mock-infected cells (M), whereas p53 was observed in both the nuclear and cytoplasmic fractions (β-actin positive) but not in the mitochondrial fraction (Cox IV positive) at 3 h p.i. The faint band in lanes 3 and 4 migrated faster than p53.

