Figure 3.
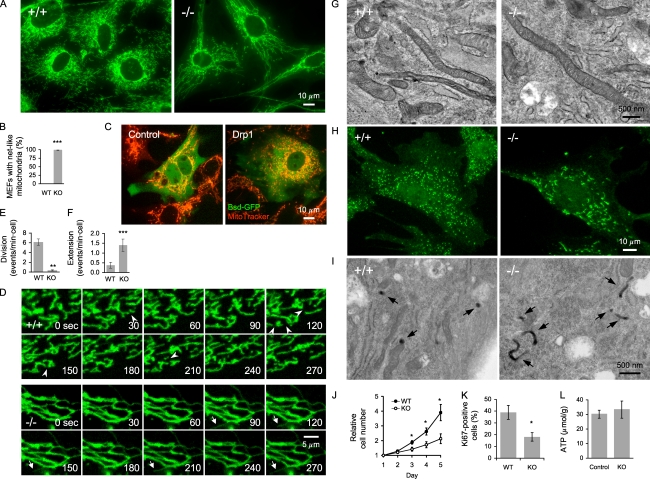
Characterization of Drp1−/− MEFs. (A) MEFs were immunostained with anti-Tom20 antibodies. (B) Quantitation of MEFs with netlike mitochondria (n ≥ 3; >100 cells/experiment). (C) Drp1−/− MEFs carrying pTracer-EF/Bsd (control; Invitrogen) and pTracer-EF/Bsd-Drp1 were stained with MitoTracker (Invitrogen). (D) Frames from time-lapse confocal microscopy (Videos 1 and 2). Arrowheads indicate mitochondrial division, and arrows show extension and retraction of mitochondrial tubules. (E and F) Quantitation of mitochondrial division (E) and extension (F; n ≥ 8). (G) EM of mitochondria in MEFs. (H) Peroxisomal morphology. MEFs were immunostained using anti-Pex14 antibodies. (I) EM of peroxisomes in MEFs. Peroxisomes were identified using cytochemical staining for catalase with DAB (arrows). (J) Cell proliferation (n ≥ 9). (K) Quantitation of Ki67-positive MEFs (n = 6; >100 cells/experiment). (L) Intracellular ATP levels in control (Drp1+/+ and Drp1+/−) and Drp1−/− MEFs (n ≥ 6). WT, wild type; KO, knockout. *, P < 0.05; **, P < 0.01; ***, P < 0.001. Error bars indicate mean ± SEM.

