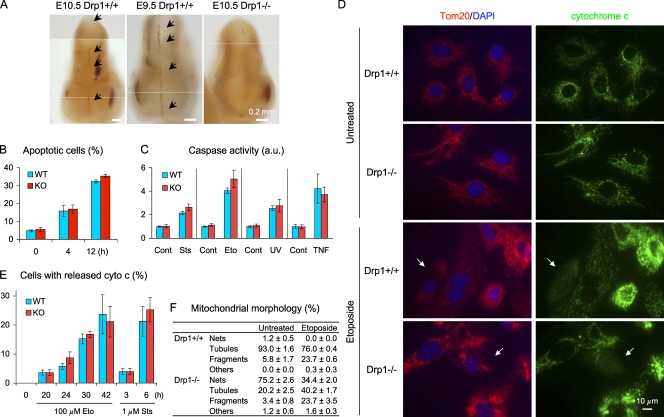
Figure 4.
Differential requirements for Drp1 in apoptosis, in vivo, and in vitro. (A) Whole-mount immunohistochemistry of embryos using antibodies to activated caspase-3. Arrows indicate apoptotic cells at the site of neural tube closure. (B) MEFs were incubated with 1 µM staurosporine for the indicated times, stained with Alexa Fluor 488–annexin V and propidium iodine, and analyzed by flow cytometry (n ≥ 3). (C) Quantitation of caspase activity (caspase-3/7) using the fluorogenic substrate DEVD-AFC. MEFs were left untreated (Cont) or treated with the following death stimuli and harvested at the indicated time points: 1 µM staurosporin (Sts; 6 h), 100 µM etoposide (Eto; 24 h), 600 J/m2 UV (24 h), and 10 ng/ml TNF-α plus 10 µg/ml cycloheximide (16 h; n ≥ 6). (D) Cytochrome c release during apoptosis. MEFs were incubated with 100 µM etoposide for 30 h in the presence of Z-VAD-FMK and immunostained using antibodies to cytochrome c and Tom20. Arrows indicate cells with released cytochrome c. (E) Quantitation of cytochrome c release (n = 3; >100 cells/experiment). (F) Quantitation of mitochondrial shape (n = 3; >100 cells/experiment). WT, wild type; KO, knockout. Error bars indicate mean ± SEM.

