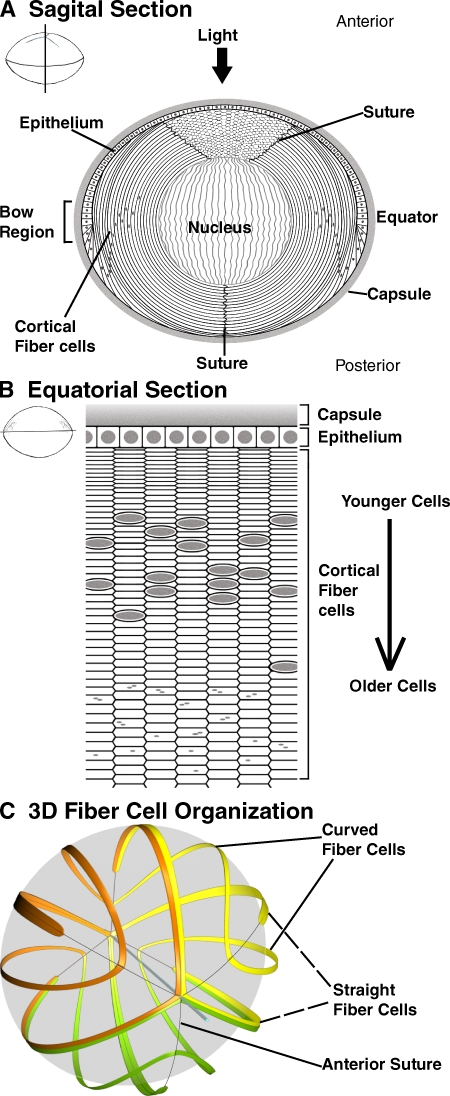
Figure 1.
Diagrams of mouse lens epithelial and fiber cell organization. (A) Sagittal and (B) equatorial sections of the mouse lens. (C) 3D-CAD reconstruction of selected fiber cells in the mouse lens, modified from Kuszak et al. (2006). Fiber cells are curved so that their ends contact one another at the offset Y-shaped sutures at the anterior and posterior of the lens. In A, note that fiber cell cross sections are visible between the two anterior suture branches in a sagittal section. Gray ovals or circles, cell nuclei. Gray dots, nuclear remnants. In C, Y-shaped sutures are indicated by thin gray lines. See Fig. S1 for a stereo pair of C.

