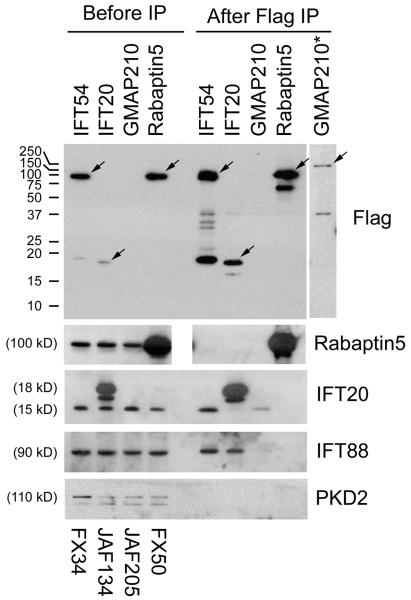
Figure 4. Interaction between IFT54 and the IFT complex.
Mouse IMCD3 cells transiently transfected with FLAG expression constructs were lysed 48 hrs after electroporation, immunoprecipitated with FLAG Ab and analyzed by western blotting. The FLAG-tagged bait protein is listed vertically at the top of the figure while name of the expression construct is listed vertically at the bottom. The left group is the starting material before immunoprecipitation and the right group is the precipitated material. The FLAG-tagged proteins are marked with arrows on the FLAG western. Note that GMAP210 is less abundant than the other proteins and is not visible at exposures reasonable for them. The right most lane (*) shows a longer exposure of immunoprecipitated GMAP210 from a different gel. Abs used for the western blots are listed on the right side. The western blot of IFT20 shows endogenous IFT20 at 15 kD and FLAG-IFT20 at 18 kD along with a degradation product of the FLAG-IFT20 that runs slightly faster. Note that the blank lane was inadvertently left out of the Rabaptin5 gel. To allow the lanes to line up, the image was split in the middle.

