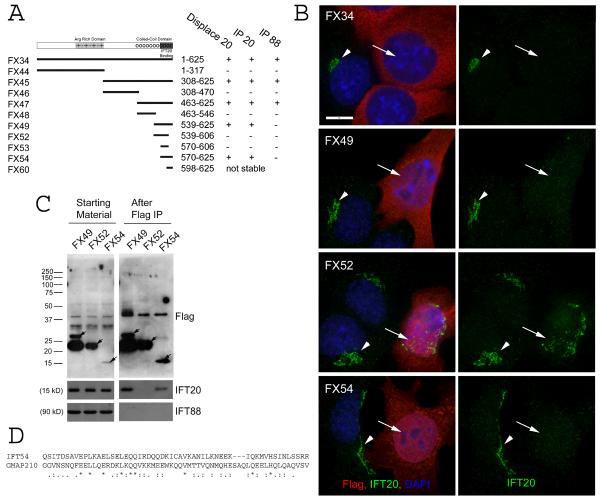
Figure 5. Characterization of the IFT20 binding site on IFT54.
A. Diagram summarizing data from experiments to map the IFT20 binding site on IFT54. Map illustrating the motif structure of IFT54 is shown on the top. Expression construct names are on the left. Exact amino acids are listed in the materials and methods. Arg rich domain is an unusual stretch of alternating positive and negatively charged residues. The coiled-coil domain is marked by series of circles. The IFT20 binding domain is marked by a solid dark bar. Summary of the activity of each of the constructs is shown on the right. B. IF of selected constructs to illustrate the ability of the C-terminal end of IFT54 (Red) to displace native IFT20 (green) from the Golgi complex. Left panel is a composite of red and green channels while the right panel shows only IFT20 staining in green. Arrows mark transfected cells. Arrowheads mark untransfected cells. Scale bar is 10 μm and relevant for all panels. C. Immunoprecipitation of selected constructs to illustrate the ability of C-terminal fragments of IFT54 to precipitate IFT20 but not IFT88. Mouse IMCD3 cells transiently transfected with FLAG expression constructs were lysed, immunoprecipitated with FLAG Ab and analyzed by western blotting. The FLAG-tagged expression construct is listed at the top of the figure. The left group is the starting material before immunoprecipitation and the right group is the precipitated material. The FLAG-tagged proteins are marked with arrows on the FLAG western. Antibodies used for western blotting are listed on the right. D. ClustalW alignment of the IFT20 binding site from IFT54 to a portion of the IFT20 binding site from GMAP210. * indicate identity, : and . mark similarity.

