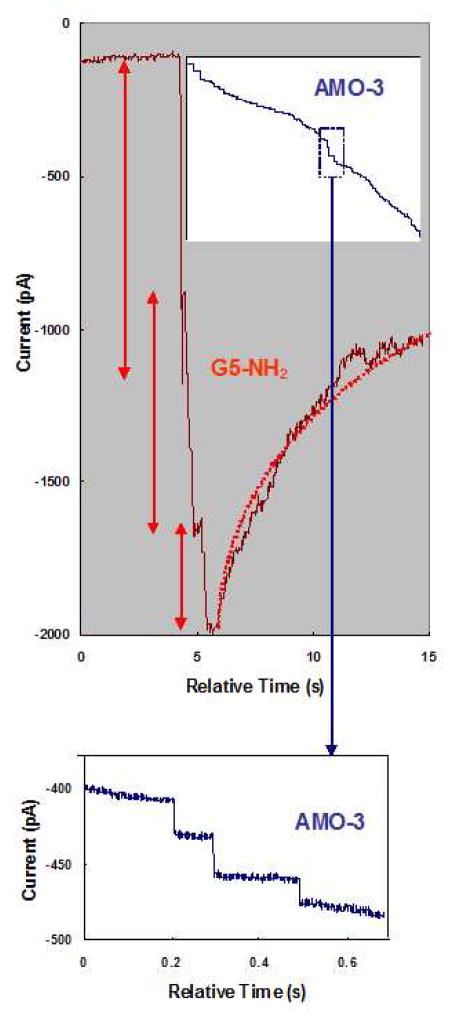
Figure 3.
Enlargement of the dotted-line insets in Figure 2(b) and (c) with the abscissa representing the relative time after application of nanoparticles. The current trace for G5- NH2 shows three individual current steps labelled with red arrows and an exponential fit of a current recovery with a dotted red line. The inset panel shows the current trace for application of AMO-3. The blue dotted box inset, enlarged in the bottom panel, shows four individual current steps and the lack of their recovery.

