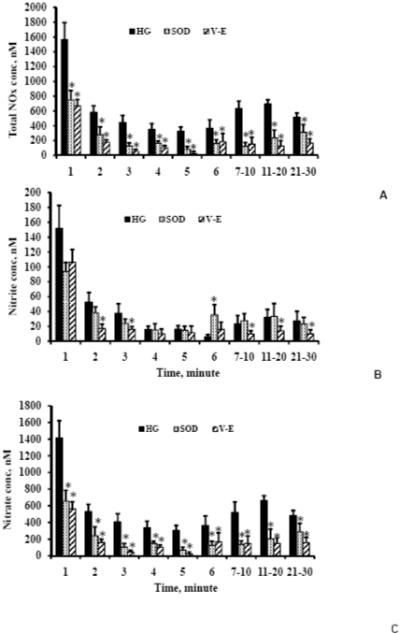
Figure 2A-C. Total NOx, nitrite and nitrate concentrations, respectively in high glucose (4500 mg/L), high glucose with 100 U/ml SOD and high glucose with 100 μM α-tocopherol.

The total NOx and nitrate concentrations significantly reduced in SOD or α-tocopherol as compared to that of in high glucose. Also, the nitrite concentrations were significantly lower for most of the time points in α-tocopherol as compared to that of in high glucose. n=4 for SOD and α-tocopherol. Values are mean ± SE. * Indicates significant difference in concentrations with p<0.05 versus corresponding values for high glucose.
