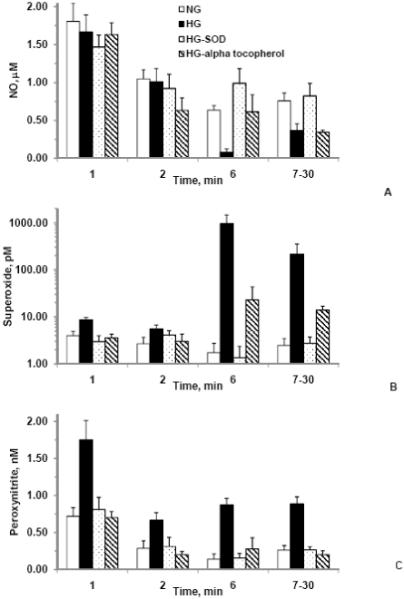
Figure 3A-C. Predicted concentrations of nitric oxide, superoxide, and peroxynitrite, respectively for normal glucose (1000 mg/L) (NG), high glucose (4500 mg/L) (HG), high glucose with 100 U/ml SOD (HG-SOD), and high glucose with 100 μM α-tocopherol (HG-alpha-tocopherol).

The concentrations were obtained using the mathematical model developed on the basis of individual values of nitrite and nitrate productions and reaction kinetics for NO and O2-. Superoxide concentrations were much higher in the high glucose whereas NO concentrations were much lower in the high glucose as compared to that of in the normal glucose. The model predicted reduction in O2- concentrations and improvement in NO concentrations in SOD as compared to that of in the high glucose. However, NO concentrations were lower in the α-tocopherol as compared to that of in the high glucose. Values are mean ± SE.
