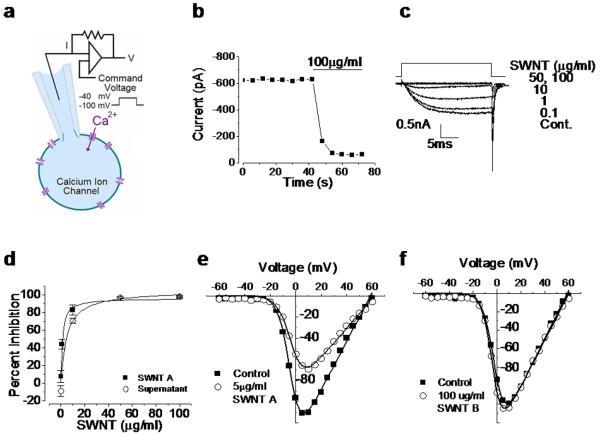
Figure 1.
SWNT sample A inhibits calcium ion channels, while SWNT sample B does not. a: Schematic of whole cell patch clamp experiment. b: Time course of calcium current under constant voltage step exposed to 100 μg/ml SWNT A. Horizontal bar indicates the time of nanotube application. c: Calcium current traces from cell exposed to 0.1, 1, 10, 50 and 100 μg/ml SWNT A. X axis is time in ms and the Y axis is calcium current in mA. d: Dose response of calcium current inhibition resulting from exposure to varying concentrations of SWNT A (solid squares) and associated supernatant (i.e. nanotube-exposed buffer solution after nanotube removal) (open circles). Strong inhibition is seen even in the CNT-free supernatant! Error bars represent standard error (n=3). SWNT A data fit with a hyperbolic non-linear curve, y = 96.3x /(1.22 + x) ; the IC50 of SWNT A is 1.22 μg/ml ± 0.13. The supernatant is fit with hyperbolic non-linear curve y = 105x /(5.0 + x) and the associated IC50 is 5.00 μg/ml ± 2.3. e: Entering calcium current as a function of command voltage over the range −60 mV to 60 mV of control (solid square) and 5 μg/ml SWNT A exposed cell (open circle). The maximum current observed in the control cell occurred at 5 mV and is −111 pA. The maximum current after exposure to 5 μg/ml is at 10 mV and is −69.4 pA. f: Entering calcium current as a function of command voltage over the range −60 mV to 60 mV of control (solid square) and 100 μg/ml SWNT B exposed cell (open circle). Maximum current of −199 pA was observed at 10 mV in control and −125 pA at 5 mV. Panel 1a adapted from Dunlop et al Nature Reviews 2008 [32]

