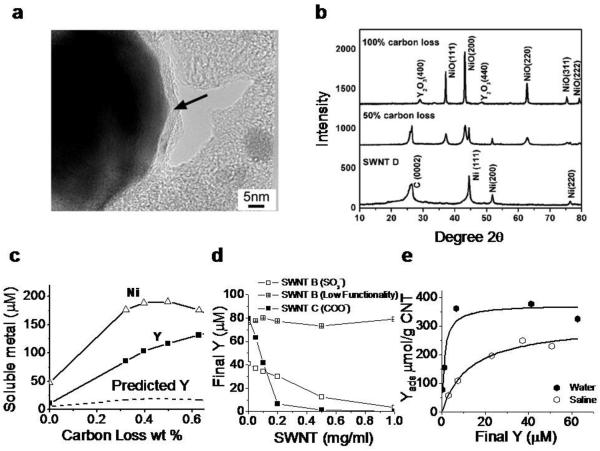
Figure 4.
Yttrium phases in SWNTs and mechanisms of yttrium ion release and recapture by SWNT surface functional groups. a: Typical metal catalyst morphology in arc-synthesized SWNT (sample D): Ni/Y nanoparticles are encapsulated in thin (2 – 10 nm) carbon shells (arrow). Previous studies on nanotube nickel and iron show that carbon-shells protect most but not all metal from fluid-phase attack by dioxygen or protons that leads to oxidation and soluble ion release[16,24,33]. b: X-ray diffraction spectra show that most metal is in the form of zero-valent metal nanoparticles with nickel lattice spacing, which upon extensive dry air oxidation can be converted to separate NiO and Y2O3 phases. c: Effect of controlled air oxidation of SWNT D on metal phases and ionic release into a cellular lysosomal simulant buffer at pH 5.5 (2 hr incubation at room temperature of 1.0 mg/ml SWNTs). The dashed curve gives the soluble Y concentration expected if the release were proportional to the Ni release at the initial Ni:Y ratio of 7:1 w/w. SWNT D is marketed as purified and contains a total metal content of 14.3 wt-% Ni and 2.1 wt-% Y by independent analysis. d,e: Fundamental adsorption isotherms that characterize the interactions of soluble yttrium with nanotube surface functional groups. D: sulfonated and carboxylated nantubes remove yttrium ion from solution by surface binding, while the graphenic surfaces of unfunctionalized nanotubes have little effect. e: Adsorption isotherms for yttrium ion binding on SWNT-COOH in pure water and saline. pKa of these COOH groups determined here to be 3.5 by mass titration. Panel E data allow estimation of the fundamental equilibrium constants for competitive Y3+/Na+ binding (see dashed curves and analysis in Supplemental). Kd = 1.2 μM (for Y3+/SWNT-COO−); and Kd = 9060 μM (for Na+/SWNT-COO−).

