
Figure 2. Unfolding of the A2 domain.
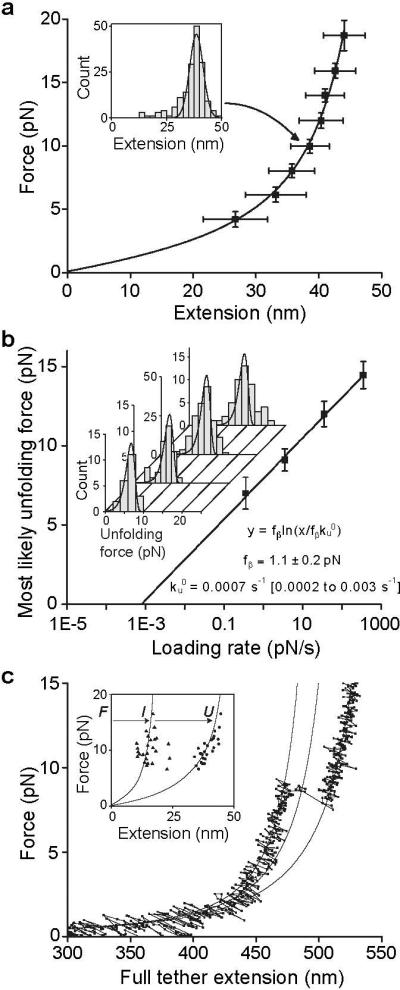
a. A2 domain force-extension data with an error-weighted least squares fit to the worm-like chain model (line) (14). Extension distances were sorted by unfolding force into 2 pN bins. A histogram of extensions for each bin (inset) was fit to a Gaussian (inset, solid line) to find peak extension, and force averaged for that bin. Uncertainty in extension is shown as the half width of the Gaussian fit and uncertainty in force is shown as one standard deviation. b. Unfolding force as a function of loading rate. Unfolding forces were binned by loading rate and plotted as histograms (inset). The peak of each histogram was plotted against the loading rate; uncertainty in y is shown as half of the bin width. A linear fit to the data (line) predicts the distributions of unfolding force (inset, lines), which agree well the histograms (inset). c. Representative force-extension trace for a tether pausing at an intermediate state, with three
WLC curves (solid lines) representing DNA + folded A2, DNA + partially unfolded A2, and DNA + fully unfolded A2. Inset: Extensions of A2 to intermediate (I) and unfolded (U) lengths, fit to the WLC model (lines).