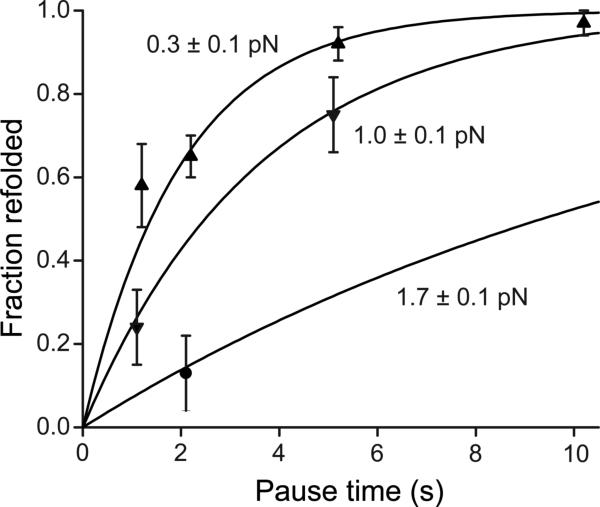
Figure 3. A2 domain refolding kinetics.
Binary refolding events were binned by clamp force and time. Standard errors (bars) were calculated as (p*(1-p)/n)0.5, where p is fraction refolded and n is number of events. Overlaid on the data are the exponential curves predicted by maximum likelihood estimation (i.e. on the data without binning) using the τ∼ exp(f2) model.

