Figure 1.

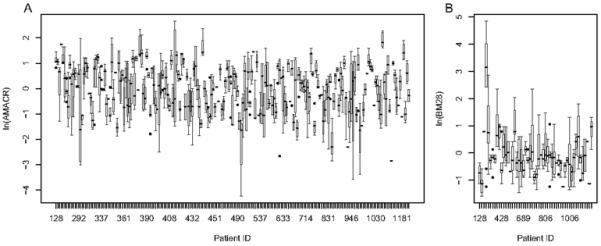
Variance plots to represent the within-subject variation in the TMA core-level expression data. A) The AMACR data. Estimates of the variance components are: and . B)
The BM28 data. Estimates of the variance components are: and .

Variance plots to represent the within-subject variation in the TMA core-level expression data. A) The AMACR data. Estimates of the variance components are: and . B)
The BM28 data. Estimates of the variance components are: and .