Figure 2.

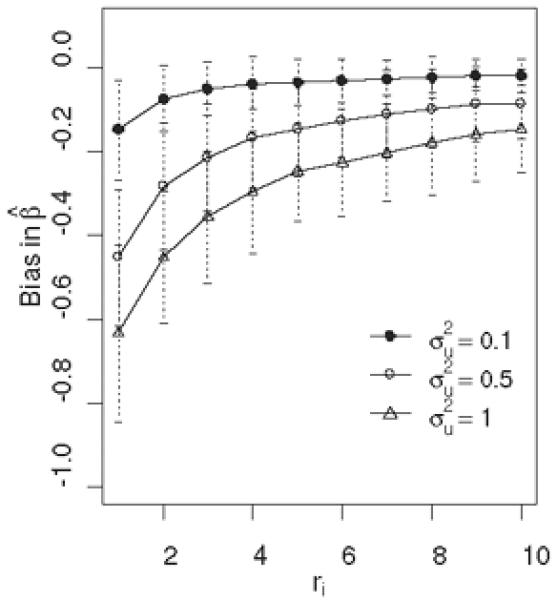
A simulation demonstration of the bias in Cox regression coefficient estimate as a function of the number of repeated measures ri. The average bias with a 95% CI over 100 simulated datasets of sample size n=200 is plotted.

A simulation demonstration of the bias in Cox regression coefficient estimate as a function of the number of repeated measures ri. The average bias with a 95% CI over 100 simulated datasets of sample size n=200 is plotted.