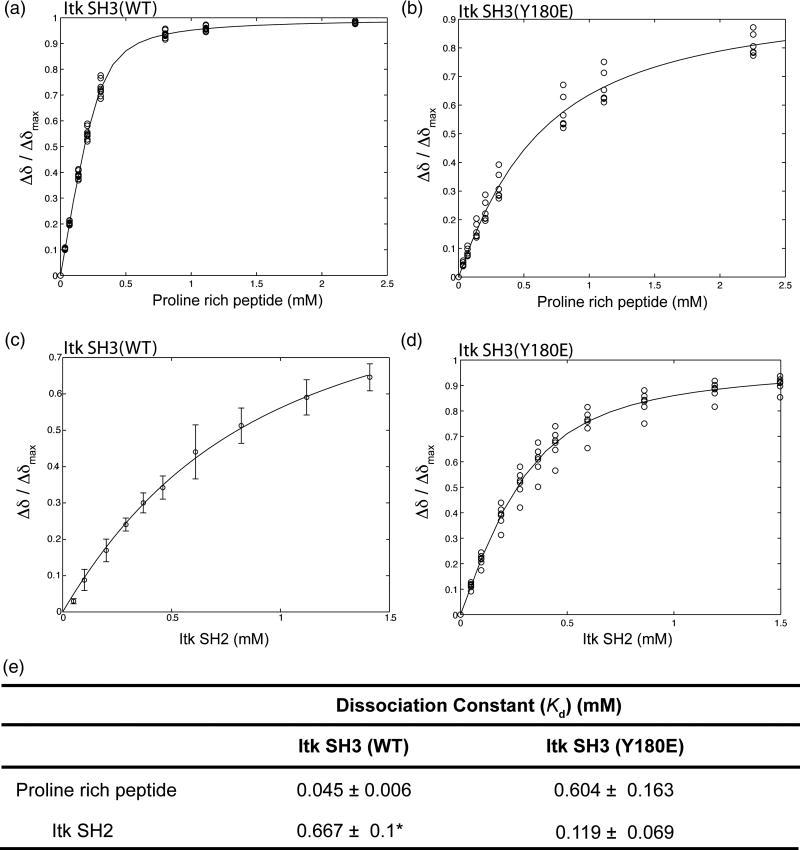
Figure 3. Mutation of Itk SH3 Y180 to Glu modulates ligand binding by the SH3 domain.
300 μM (initial concentration) of either 15N labeled wild type Itk SH3 (A) or 15N labeled SH3 Y180E mutant (B) were titrated with increasing concentration of a proline rich peptide (GWYSKPPPPIP). In a similar manner, 250 μM (initial concentration) of either 15N labeled wild type Itk SH3 (C) or 15N labeled SH3 Y180E mutant (D) were titrated with increasing concentration of unlabeled Itk SH2 domain. 1H-15N HSQC spectra were obtained upon addition of each aliquot of ligand. Binding curves were generated by plotting the normalized concentration dependence of amide 1H chemical shifts for resonances corresponding to Y182, T184, Q188, E189, L192, D202, W208, W209, R210, A221, S223 and S224. (E) Dissociation constants are derived from the binding curves shown in A–D. Asterisk indicates that the dissociation constant for the wild type Itk SH3/SH2 interaction has been reported previously along with the binding curve shown in (C)22.

