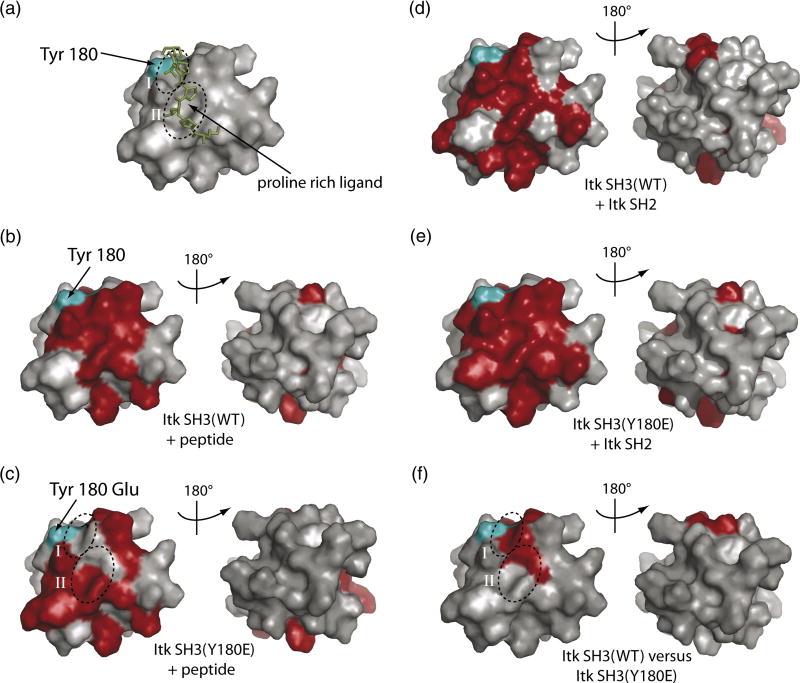
Figure 5. Surface plot of the chemical shift changes upon ligand binding.
The color scheme used for all the panels are as follows: The Itk SH3 domain (PDB ID 1AWJ) is shown in grey and is represented in identical orientations in each panel. Residues corresponding to resonances that exhibit significant chemical shift changes are shown in red and the autophosphorylation site Y180 is cyan on each structure. (A) Structure of the Itk SH3 domain (surface rendering) bound to the proline rich (KPLPPTP) ligand (represented as sticks in green). The conserved binding clefts I and II for the proline peptide on the surface of the SH3 domain are circled and labeled. (B) Proline rich ligand binding to the wild type Itk SH3 domain. (C) Proline rich ligand binding to the Y180E Itk SH3 mutant. (D) Itk SH2 domain binding to the wild type Itk SH3 domain. (E) Itk SH2 domain binding to the Y180E Itk SH3 mutant. (F) SH3 residues that exhibit changes in resonance frequencies upon mutation of Y180 to Glu.

