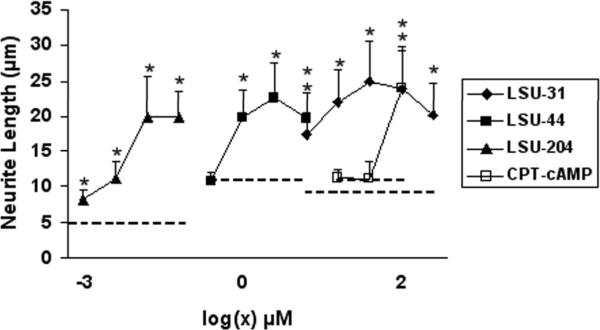
Fig. 4.
Concentration-response curves for LSU-31, LSU-44, LSU-204 (staurosporine), and CPT-cAMP. Individual compounds were tested over an 8-fold range to determine the concentrations required to elicit a significant response, as compared to control. Data are presented as average neurite length (μm) ± S.E. Significant differences are indicated as before by asterisks (*p<0.05). Dotted lines represent the corresponding control value for each compound. The P values were as follows: LSU-31 (all < 0.001), LSU-44 (0.01 at 2.5 μM, and all higher concentrations < 0.001), LSU-204 (0.01 at 2.5 nM, and all higher concentrations < 0.001), CPT-cAMP (< 0.001 at 80 μM).

