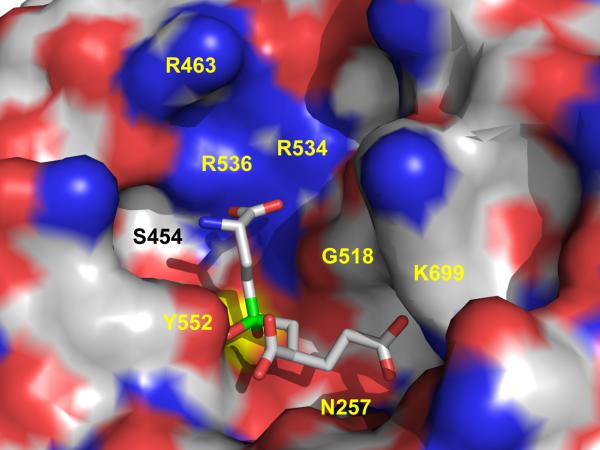
Figure 4. The active site of human GCPII with the EPE inhibitor bound.
The dissected substrate-binding cavity of GCPII is represented by its molecular surface and the active site-bound EPE inhibitor is shown in stick representation. The atoms are colored blue (nitrogen), red (oxygen), green (phosphorus), yellow (Zn2+ ions), and gray (carbon atoms). Note the patch of positively charged arginines 463, 534 and 536 contributing towards the preference of GCPII for acidic residues in the P1 position of a substrate. The figure has been generated using Pymol.

