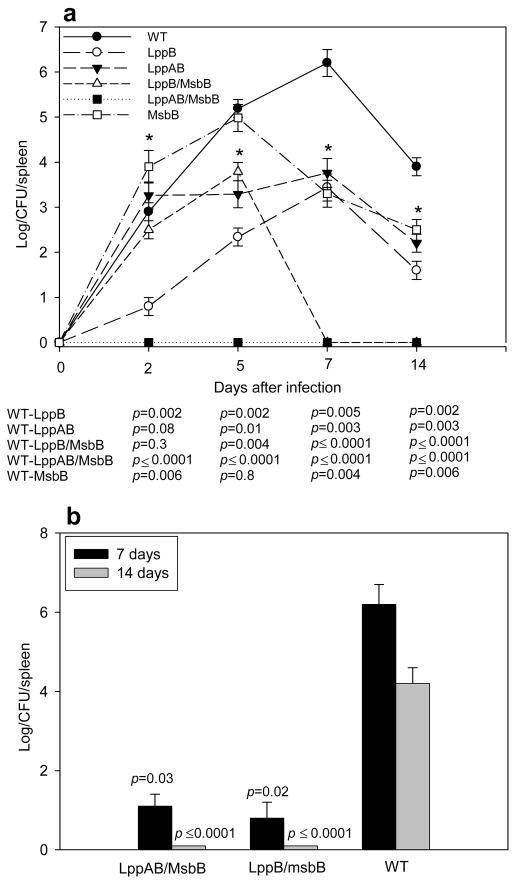
Figure 3.
Bacterial growth in the spleens of infected Swiss-Webster mice. a) Mice were infected via i.p. injection with 1 × 10³ cfu of WT or various mutant strains of S. Typhimurium (symbols are defined in the figure). At the indicated times, cfu in the spleens were determined. Data are expressed as mean ± S.D. and p-values < 0.05 are considered statistically significant (*). b) Mice were injected with 1 × 10³ cfu of lppB/msbB or lppAB/msbB mutant S. Typhimurium, and rechallenged with 1 × 10³ cfu of WT S. Typhimurium after 30 days. Seven or 14 days after the rechallenge, cfu in the spleens were determined. The p-values were determined for the comparison between immunized groups vs. a control group given a primary challenge with 1 × 10³ cfu of WT S. Typhimurium. The p-values were < 0.05 for all immunized groups compared to a control group given a primary challenge with 1 × 10³ cfu of WT S. Typhimurium for 7 and 14 days. The actual p-values (Student’s t-test) are provided.

