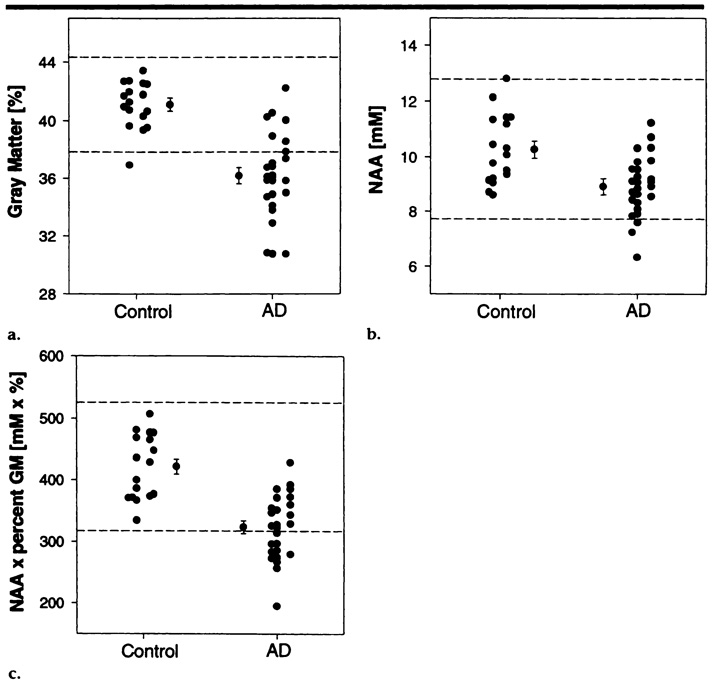
Figure 4.
Distribution in control subjects and AD patients of (a) percentage of cortical gray matter, (b) volume-corrected NAA level in mesial cortex, and (c) the product of percentage of cortical gray matter (GM) and volume-corrected NAA level in mesial cortex. Data points with an error bar indicate group means ± the standard error of the mean. For each group (control and AD) data points on the left indicate results in women, and those on the right indicate results in men. Dashed lines = 95% confidence interval in control subjects. mM = mmol/L.

