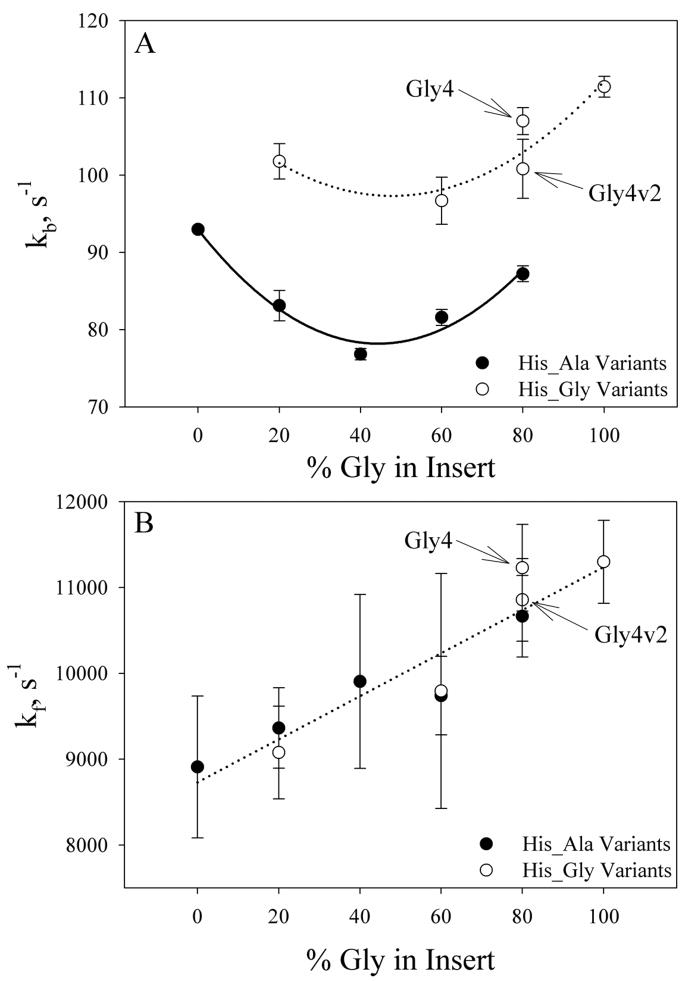
Figure 3.
(A) Loop breakage rate constants, kb, at 25 °C in 3 M gdnHCl plotted as a function of % Gly in Insert and grouped based on whether Gly follows His, His_Gly variants (○) or Ala follows His, His_Ala variants (●). The dotted and solid lines are meant to guide the eye and have no physical significance. (B) Loop formation rate constants, kf, at 25 °C in 3 M gdnHCl plotted as a function of % Gly in Insert and grouped based on local sequence, His_Gly variants (○) or His_Ala variants (●), as in part A. The dotted line is meant to guide the eye and has no physical significance.

