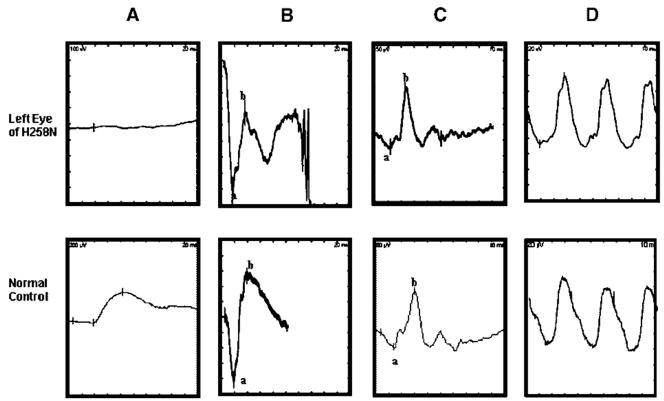
FIGURE 1.
Representative ERG recordings from a patient (top row) and a normal control (bottom row). Shown from left to right are a rod-isolated response (A), the dark-adapted maximal response (B), the light-adapted responses to a single flash (1 Hz) (C) and flickering (30 Hz) stimuli (D). a- and b-waves are identified using conventional techniques. Note the barely detectable rod-isolated response (A) and the selective loss of the b-wave for the dark-adapted maximal response in the patient’s data (B) compared to the normal control.

