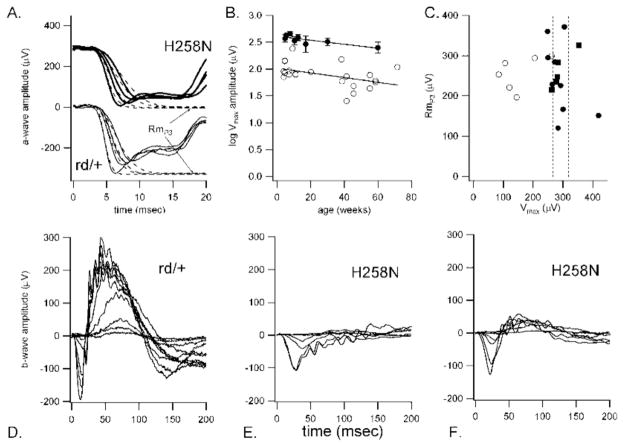
FIGURE 5.
A: Representative panretinal ERG photoresponses from H258N, (upper traces) and Pde6brd1/+ control mice (lower traces) on the (B6CBA × FVB) F2 albino background. The dashed lines through each dataset represent the fit of a rod model used to derive Rmp3, the saturated photoreceptor response, and S, photoreceptor sensitivity. B: Saturated b-wave amplitudes (Vmax) across age for H258N (open circles) and wildtype (+/+) control mice (filled circles). C: Rmp3 vs. Vmax amplitudes for H258N (open circles), Pde6brd1/+ (filled squares) and +/+ control mice (filled circles). The vertical dashed lines are the standard error bars forVmax for the +/+ control mice. Note the shift in Vmax amplitudes to the left, indicating reduced amplitudes for the H258N mice. D–F: Representative ERGs from Pde6brd1/+ control mice (D), and two H258N mutant mice from independent founders in (B6CBA × FVB) F2 albino background(E,F).

