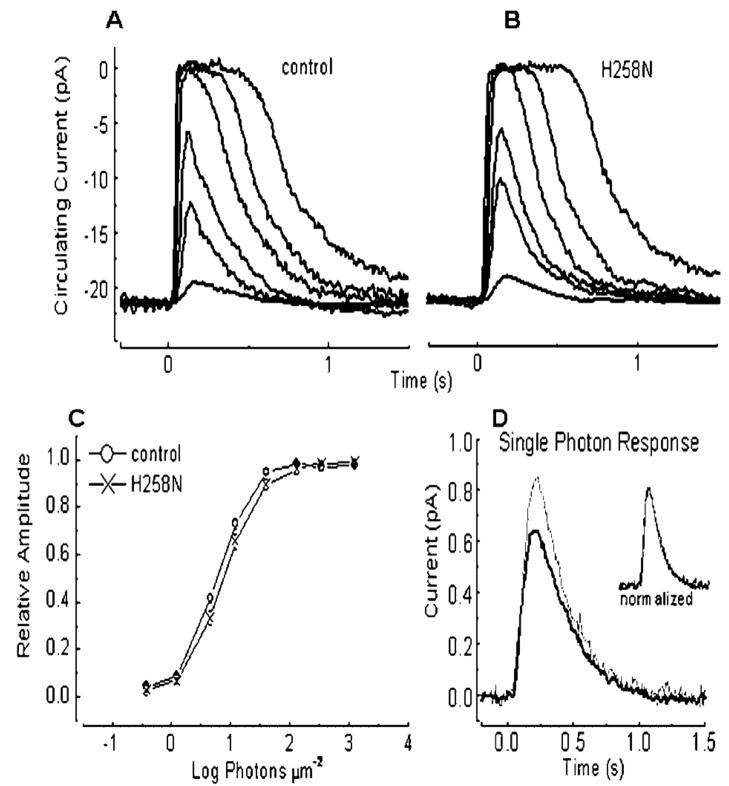
FIGURE 7.
Responses of H258N and control rods to light. A: C57BL/6J control rod, 20msec flashes of 500-nm light at flash intensities of 17, 43, 160, 450, 1,120, and 4,230 photons μm −2. The traces are averages of two to four flashes at each intensity. B: Typical responses from a H258N rod to the same flash intensities. Each trace was averaged from three to eight flashes. C: Response amplitude vs. flash intensity averaged from 34 wild-type (WT; ○) and H258N rods (H258N; X). (The lowest intensity response [smallest response] was obtained by averaging 60 flashes, the others were averaged using five flashes.) D: Averaged single-photon responses from H258N (thin line; n = 18) rods superimposed on averaged single-photon response from control rods (thick line; n = 48). Single-photon responses were calculated for each rod individually from 15 to 60 dim flashes with the squared mean-variance method.

