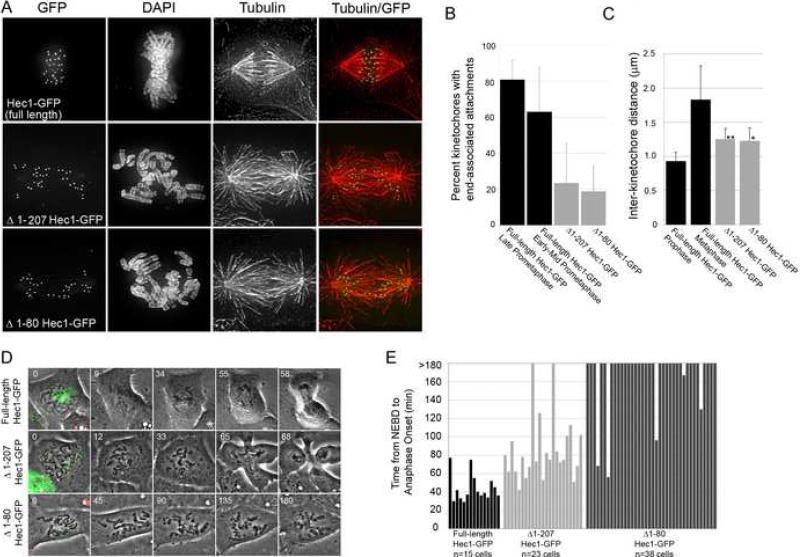
Figure 2. The N-terminus of Hec1 is required for kinetochore-microtubule attachment.
(A) Projections of deconvolved immunofluorescence images of PtK1 cells depleted of endogenous Hec1 and rescued with the indicated GFP-fusion proteins.
(B) Quantification of end-on microtubule association with kinetochores (full-length Hec1-GFP late prometaphase: n= 10 cells / 256 kinetochores; full-length Hec1-GFP early-mid prometaphase: n= 10 cells / 251 kinetochores; Δ1-207 Hec1-GFP: n= 10 cells / 214 kinetochores; Δ1-80 Hec1-GFP: n= 10 cells / 217 kinetochores).
(C) Quantification of inter-kinetochore distances, which were measured from Hec1-GFP-centroid to Hec1-GFP-centroid (full-length Hec1-GFP prophase: n= 11 cells / 46 kinetochore pairs; full-length Hec1-GFP metaphase: n= 12 cells / 75 kinetochore pairs; Δ1-207 Hec1-GFP: n= 21 cells / 88 kinetochore pairs; Δ1-80 Hec1-GFP: n= 21 cells / 90 kinetochore pairs). The P values (asterisk and double asterisk) are <0.0005, as measured by Student's t-test (vs. full-length Hec1-GFP metaphase).
(D) Image stills from time-lapse image acquisitions. Cells positive for both Cy5 Hec1 siRNA and the GFP fusion protein indicated (first panel of each series) were identified and imaged using a 100X phase-contrast objective. Time is indicated in min.
(E) Quantification of mitotic timing (full-length Hec1-GFP: n= 15 cells; Δ1-207 Hec1-GFP, n= 23 cells; Δ1-80 Hec1-GFP: n= 38 cells). Time was scored from nuclear envelope breakdown (NEBD) to anaphase onset. Cells were imaged for 3 h, and those cells still in mitosis at the end of imaging were scored as >180 min. Vertical line in all bar graphs indicates standard deviation.

