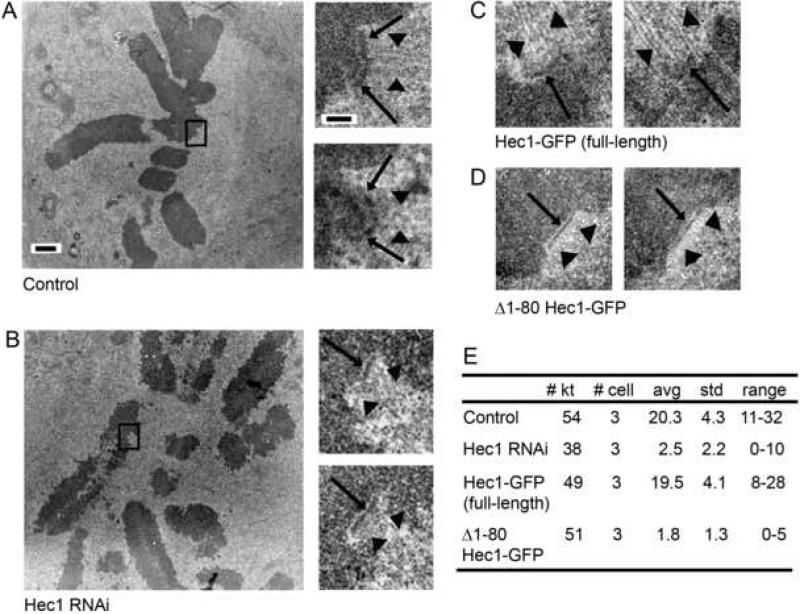
Figure 3. Kinetochore ultrastructure in Hec1-depleted and Δ1-80 Hec1-GFP rescued PtK1 cells.
(A) Mock-transfected cell. On the left is a low magnification image showing the metaphase alignment of the chromosomes. On the right are higher magnification images of two serial sections through the kinetochore indicate by the box in the low magnification view. Images show a distinct outer plate (arrows) and robust kinetochore fibers (arrow heads).
(B) Hec1 siRNA-transfected cell. On the left is a low magnification image showing that Hec1 cells are unable to achieve metaphase alignment or form robust kinetochore fibers. On the right are higher magnification images of two serial sections through the kinetochore indicated by the box in the low magnification image. Although a distinct outer plate is frequently observed (arrows), few bound microtubules were detected. In addition, a fibrous corona characteristic of unbound kinetochores is evident (arrowheads).
(C) Hec1-depleted cells rescued with full-length Hec1-GFP. High magnification views showing a distinct outer plate (arrows) with numerous bound microtubules (arrowheads) similar to that seen in (A).
(D) Hec1-depleted cells rescued with Δ1-80 Hec1-GFP. High magnification views show unbound kinetochores with distinct outer plate (arrows) and corona (arrowheads), similar to that see in (B).
(E) Quantification of kinetochore-microtubule attachment. The number of kinetochores scored (# kt), number of cells analyzed (# cell), average number of attached microtubules per kinetochore (avg), standard deviation (std), and range of values (range) are listed for each experimental condition.
Scale bar for low magnification images in A and B =1.0 μm. Scale bar for high magnification images in A-D = 200 nm.

