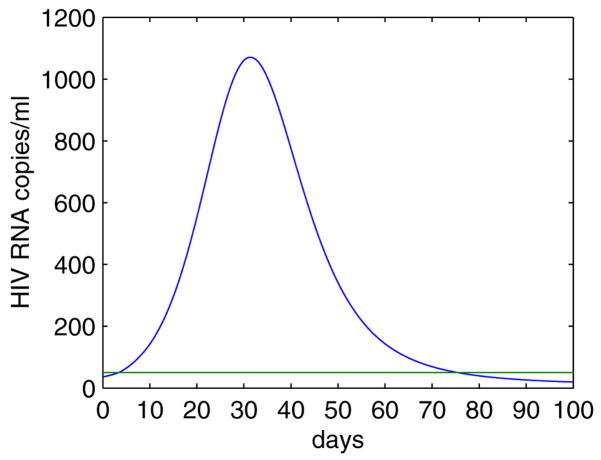
Figure 6.
Simulation of the target cell activation model (Eq. (21)). The model can generate a transient viral load increase. The parameter values are [101]: λ1 = 104 mL−1 day−1, λ2 = 56 mL−1 day−1, k1 = 8 × 10⁻⁷ mL day−1, k2 = 10−4 mL day−1, ε = 0.9, dT = 0.01 day−1, f = 0.6, ϕ = 0.195, δ = 0.7 day−1, μ = 0.07 day−1, NT = 100, NC = 4.11, c = 23 day−1, a = 0.2 day−1, K4 = 1000 mL−1, r0 = 2 day−1, Amax = 108 mL−1, γ = 10−3 day−1, d0 = 0.01 day−1, p = 2.92 day−1, d = 0.1 day−1, dE = 0.325 day−1, p0 = 1 day−1, n = 1, K8 = 1000 mL−1. The green horizontal line represents the detection limit.

