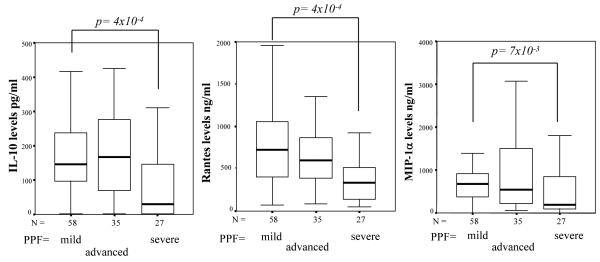
Fig. 1. Production of IL-10, RANTES and MIP-1α in SEA-stimulated cultures of PBMC from subjects with no or mild (A, B, CLL), advanced (CLM) or severe fibrosis (CLH, D, E, F).
The horizontal black line within the boxes represents the median value. The boxes indicate the 25th to 75th percentile range and the error bars indicate standard deviation. The association of each cytokine (univariate analysis) with clinical phenotype was assessed with the Mann-Whitney test.

