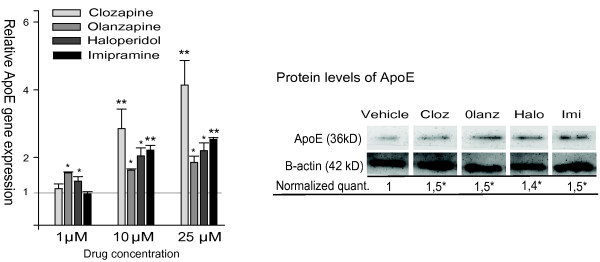
Figure 1.
The relative gene expression and protein levels of ApoE in psychotropic drug-exposed human glioma (GaMg) cells. Left panel: The relative level of ApoE mRNA, measured by Q-RT-PCR after 24 hours exposure, of 1 μM, 10 μM or 25 μM of drug as compared to vehicle-exposed controls. The bars represent mean values ± SEM (n = 3). Right panel: The protein level of ApoE determined by western blotting in GaMg cells exposed to 25 μM of the drug (clozapine, olanzapine, haloperidol and imipramine) or vehicle for 24 hours. The data are normalized relative to the level of beta-actin, showing mean values ± SEM (n = 3) of the ratio between the drug- and vehicle-exposed cells. * indicates p < 0.05, ** indicates p < 0.01.

